
Real example report · worked calculation, not a quotation
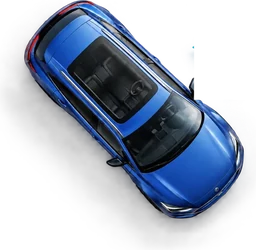
Land Rover Discovery Sport 2018
Every example uses the same standard scenario: 7,400 miles a year, 3-year ownership, finance purchase. So the figures compare directly across cars.
- Make
- Land Rover
- Model
- Discovery Sport
- Year
- 2018
- Fuel
- Diesel
- Engine
- 2.0 L
- CO2
- 139 g/km
Total cost of ownership
Source data: Read from one real 73 Auto report, calculated under the standard scenario stated above.Calculated as the report's annual ownership cost (£5,856) x the 3-year ownership period. Not a figure printed in the source report.
Cost breakdown
Every category this report covers, largest first.
Quick answers
?What does it cost to own a Land Rover Discovery Sport 2018?
In this real 73 Auto example, total cost of ownership for this Land Rover Discovery Sport 2018 is £488/month (£5,856/year), based on 7,400 miles/year over a 3-year finance ownership scenario.
?What are the running costs of a Land Rover Discovery Sport 2018?
Day-to-day running costs, including fuel / energy, service & MOT and insurance and 5 other costs, total £3,688/year (£307/month) in this example, excluding depreciation and finance.
?What is the road tax (VED) for a Land Rover Discovery Sport 2018?
VED (road tax) for this Land Rover Discovery Sport 2018 is £180/year in this example.
?What is the depreciation on a Land Rover Discovery Sport 2018?
Depreciation accounts for £1,618/year (28% of the total cost) for this Land Rover Discovery Sport 2018 in this example.
What drives this cost
For this Land Rover Discovery Sport 2018, Depreciation is the largest ownership-cost category, making up 28% of the annual total (£1,618/year of £5,856/year). The next-largest category is Fuel / Energy, at 19% of the total. Depreciation and finance together make up 37% of the annual cost, while day-to-day running costs (fuel/energy, insurance, servicing, maintenance, tax, tyres and roadside assistance combined) make up 63%. As a diesel vehicle, fuel costs are calculated from a fuel price of £1.45/litre at 45mpg, making up 19% of the total.
What this example is
This is a worked example for one specific vehicle under the stated assumptions, not a quotation or financial advice. A different registration, condition, location, driving pattern, insurance profile or finance agreement will produce a different result. See the methodology and data sources behind this figure.
For what these figures add up to and why, see what Total Cost of Ownership means and UK car running costs.